We may earn revenue from the products available on this page and participate in affiliate programs. Learn More ›
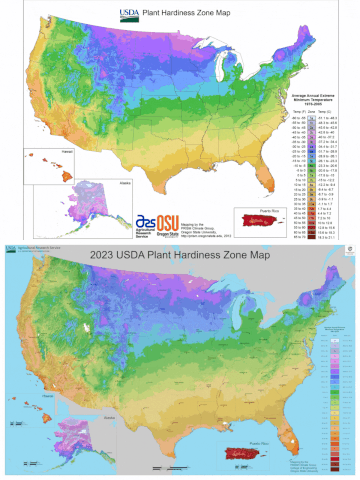
Sometimes called “growing zones” or “gardening zones,” hardiness zones refer to a map developed by the USDA that separates the United States into regions based on the average low winter temperatures. For the first time since January 2012 and with the help of Oregon State University, the map has been updated, and now incorporates data from 13,412 weather stations, compared to the 7,983 stations that were used for the 2012 edition.
The maps help gardeners identify which plants will thrive in their area. Some plants adapt to a variety of conditions, including soil type, watering fluctuations, and humidity differences, but most plants will only tolerate a specific degree of chill in the winter. That’s where hardiness zones come in—they list the average lowest temp in every area of the country, so gardeners can select perennial plants that will survive the type of winters common to specific regions.
What changes were made in the 2023 USDA Plant Hardiness Zone map?
The 2023 USDA Plant Hardiness Zone map, which was generated based on weather data gathered from 1991 to 2020, indicates that about half the United States moved into a warmer zone. “Overall, the 2023 map is about 2.5 degrees warmer than the 2012 map across the conterminous United States,” says Christopher Daly, a professor and climatologist at Oregon State University and the map’s lead author. “This translated into about half of the country shifting to a warmer 5-degree half zone, and half remaining in the same half zone.”
Daly says the central plains and Midwest areas of the country generally warmed the most, while the southwestern U.S. warmed very little.
While it might be tempting to assume climate change is at play, the USDA cautions that “temperature updates to plant hardiness zones are not necessarily reflective of global climate change” according to a press release announcing the new map. “The use of increasingly sophisticated mapping methods and the inclusion of data from more weather stations” also play a role in the map’s shift, according to the USDA.
Daly agrees. Assigning plant hardiness zones and the reasons the 30-year data led to a half-zone shift is too complex to attribute to one cause, such as climate change, he says. However, he adds, “In the long run we would expect these zones to continue to creep northward, which we may be able to attribute to climate change.”
Hardiness Zones 101
The USDA Plant Hardiness Zone Map consists of 13 individual zones that take in all of the contiguous United States, plus Alaska, Hawaii, and Puerto Rico. The first zone lies at the coldest and northernmost areas of Alaska. In these regions, winter temps can dip as low as -60 degrees Fahrenheit. On the southernmost part of the scale lies Zone 13, where winter lows remain above 65 degrees Fahrenheit.
Zones represent low temperatures in 10-degree increments, and each zone is further broken down into two additional segments, “a” and “b,” representing 5-degree increments. You may see hardiness maps produced by other organizations, such as that produced by the Arbor Day Foundation, that include the 13 zones, but might not feature the “a” and “b” breakdowns.
What Hardiness Zones Won’t Tell You
Hardiness zone maps are essential for helping gardeners choose plants, but they’re not all-inclusive categories. Some vital factors that require consideration are not covered on a hardiness zone map.
- Maximum temperature: The average hottest summer temperature isn’t found on a hardiness map, but it might be vital to a plant’s survival. Gardeners should research the plant species to determine whether it will survive the heat in the region.
- Precipitation: Some plants require a lot of water, while others prefer a desert-type environment. The USDA Hardiness Zone map does not include average precipitation amounts.
Average frost dates: Planting too soon in the spring could result in the need to cover plants at night if temps dip below freezing. Likewise, gardeners might extend the fall growing season by covering plants or bringing them into a greenhouse. Average first and last frost dates can be found on The Old Farmer’s Almanac by ZIP code. - Microclimates: Is your house in a depression? On a hill? In an urban area or a rural one? “It comes down to the microclimate at your house,” says Daly. All of these factors can impact what plants will do well at your house. “All we’re doing is giving you the baseline average based on what we know.”
RELATED: First and Last Frost Dates: What All Home Gardeners Should Know
Typical Hardiness Zones by Region
For a closer look at different regions, the USDA offers an interactive tool that allows users to see a compilation of hardiness zones in one of five general regions of the contiguous states.
- North Central: From the northern border of the United States, ranging as far west as South Dakota, as far east as Illinois, and taking in Kansas and Missouri, the North Central region of the nation encompasses four hardiness zones, from 2b to 7b, with minimum winter temps ranging from -50 to 5 degrees Fahrenheit.
- Northeast: Following the eastern seaboard from Maine to Virginia and extending as far west as Kentucky and Michigan, the North East region includes portions of five zones, ranging from 2b at the northern border to 8b at the southernmost tip of Virginia (-40 to 15 degrees Fahrenheit).
- Northwest: This hardiness zone takes in all of Montana and Wyoming and then extends west to the western seaboard, and features a wide range of hardiness zones, from 3a in parts of Montana to 10a along the coast of Oregon and Washington (-40 to 30 degrees Fahrenheit).
- South Central: Featuring just four states, Texas, Louisiana, Arkansas, and Oklahoma, the South Central hardiness region encompasses zones from 6b in the northern areas to 10b at the southern tip of Texas (-5 to 35 degrees Fahrenheit).
- Southeast: Taking in Tennessee and Mississippi, extending from there east to the Atlantic Coast, and encompassing all states to the south, the South East region ranges in hardiness from zone 6a to 11ab (-5 to 45 degrees Fahrenheit).
- Southwest: Including Colorado and the states to the west and south, the South West hardiness region features a wide range of zones, from 3b to 11a, or from -30 to 40 degrees F.

How to Use Your Hardiness Zone
Use the hardiness map to find the average lowest winter temperature in your community and then choose plants that will survive that temp. To simplify the process, most commercial greenhouses provide detailed plant labels that list suitable hardiness zones, the lowest temperatures the plants can survive, and other vital information, such as whether they will grow better in the sun or shade.
Use the zone map as one factor in choosing a plant. However, don’t forget to check off all the boxes on its other needs. If you’re concerned about how the new map might affect your existing garden, or plants you may want to add, Daly says not to worry. “The changes are fairly small and if you flip zones, don’t freak out,” he says. “You don’t have to go out and buy all new plants.”
RELATED: 34 Amazing Plants That Are Native to North America

When in doubt, opt for native plants.
Plants that are indigenous to an area are always good choices. These native plants are well suited to the average minimum winter temps and the typical amount of rain, type of soil, and average summer heat in the region.
In addition to being good options for thriving in the area, native plants also play a vital role in xeriscaping, the practice of growing plants that do not require a lot of extra water, fertilizer, or pesticides, because they’re well adapted to the region. In this way, using native plants will help conserve water and cut down on the number of chemicals introduced in the environment.


